Menu
- Product
By Asset Type
By User Segment
- Company
- Pricing
- Why Prescinto
- Resources
- Product
By Asset Type
By User Segment
- Company
- Pricing
- Why Prescinto
- Resources

Users can set up customizable alerts to notify them of any issues or changes in performance at their solar power plants.

Analyze the performance of individual strings within a solar power plant, helping to identify issues and optimize performance.

Digital twin technology uses data from drone inspections to create a virtual model of a solar power plant, which can be used to detect performance issues, run simulations, and generate valuable insights.
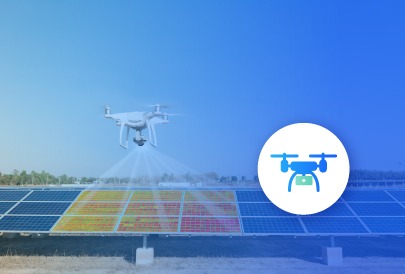
Inspect solar panels automatically using thermal imaging and advanced computer vision algorithms to identify defects at the solar panel level.
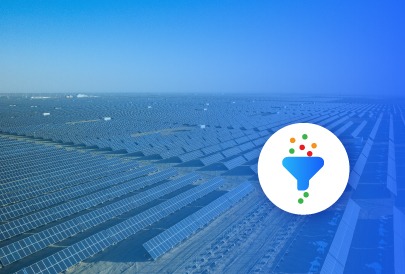
Set thresholds to remove or replace erroneous data in order to improve the accuracy of analytics.

The Tahoe tool can classify losses at a solar power plant into 12+ different categories, helping plant owners to understand the causes of underperformance and prioritize remedial actions.
Users can set up customizable alerts to notify them of any issues or changes in performance at their solar power plants.
Analyze the performance of individual strings within a solar power plant, helping to identify issues and optimize performance.
Digital twin technology uses data from drone inspections to create a virtual model of a solar power plant, which can be used to detect performanc. . .
Inspect solar panels automatically using thermal imaging and advanced computer vision algorithms to identify defects at the solar panel level.
Set thresholds to remove or replace erroneous data in order to improve the accuracy of analytics.
The Tahoe tool can classify losses at a solar power plant into 12+ different categories, helping plant owners to understand the causes of underpe. . .