Unlock Precise Insights with Baikal: The Data Governance Tool for Clean Energy Power Plants

- September 20, 2023
- Prescinto
How Baikal Works?
Baikal scans through the entire raw time-series data set to find irregularities (outliers or erroneous data) and non-availability. It classifies the defects into two major buckets: Data Availability and Data Quality.
Data Availability: Baikal checks for the percentage of missing data (blank or N/A).
Data Quality: Baikal checks for the percentage of erroneous data, which are not within the acceptable thresholds. This algorithm also checks for erroneous and zero/constant values in the data.
All the data is further bucketed into five levels as follows
- Normal – Good data
- Erroneous – Data points crossing the acceptable threshold
- Constant – The sensor is stuck at some constant value
- Zero – Zero values during generation hours
- Not Available – No data received from the plant/inverter

Key Features of Baikal
- Portfolio View: Baikal provides a complete view of the data quality and availability of individual plants at the portfolio level. This allows users to take necessary actions to improve the data performances of the plant with the largest deviation.
- Plant View: Users can get a detailed view of the individual plant and each device class at the plant level. The graph represents the percentage of data points of each parameter falling in the above categories.
- Day View: Users can choose any parameter of preference and then deep dive to find the trend of the data quality. At this level, users can identify the pattern and plan the corrective maintenance.
- Heatmap View: Users can select multiple or all the parameters of a device at a time to visualize the data in a time series chart highlighting the erroneous data sections. This feature indicates the percentage of data deviation from the ideal conditions.
Benefits of Baikal
- Improved Data Quality: With Baikal, organizations can ensure that only high-quality data is used for analytics and decision-making. This improves the accuracy and reliability of the insights derived from the data.
- Early Detection of Issues: Baikal’s advanced algorithms allow for early detection of issues such as missing data, erroneous data, and other data-related problems. This helps organizations to address the issues before they lead to significant losses.
- Comprehensive View of Data Quality: Baikal provides a comprehensive view of data quality at the portfolio, plant, and day levels. This allows organizations to identify patterns and trends in data quality and take corrective actions.
- Increased Efficiency: Baikal’s automation of data quality checks helps organizations to increase efficiency by reducing the need for manual data cleaning and analysis.
- Better Decision-making: With improved data quality, organizations can make better decisions based on accurate and reliable insights.
User Highlights
Baikal runs at three different levels to give a comprehensive view of the entire portfolio followed by plant-level insights.
Portfolio View
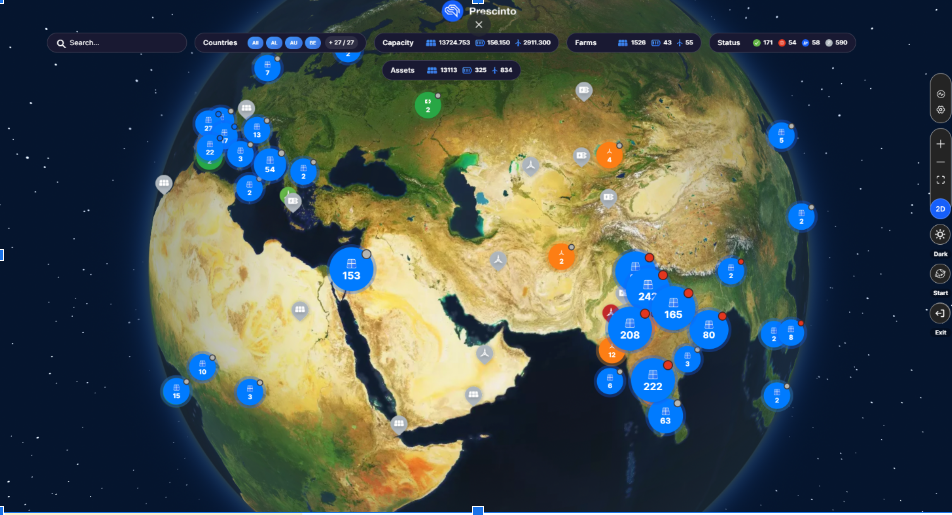
At the portfolio level, Baikal provides an overview of the data quality and availability of individual plants, giving users a comprehensive view of their entire portfolio. This allows users to quickly identify which plants may have data quality issues, and take necessary actions to improve their performance. Users can also easily navigate from the portfolio level to individual plants and devices to zoom in on specific areas of deviation.
By providing a detailed breakdown of data quality and availability at the plant and device level, Baikal empowers users to make informed decisions. Users can easily identify patterns in the data and plan corrective maintenance to improve the performance of their plants.
Plant View
The user gets a detailed view of the individual plant and each device class at the plant level. The graph represents the percentage of data points of each parameter falling in the above categories.


Day View
The day view lets the user choose any parameter of preference and then deep dive to find the trend of the data quality. At this level, the user can identify the pattern and plan the corrective maintenance.
The heatmap representation helps the user to detect the instances where there was a deviation from the expectations. Clicking the heatmaps for Erroneous and Zero/Constant takes the user to a time series chart that highlights the errors in the data for that particular period and parameter.

Heatmap View – All Parameters
Multiple or all the parameters of a device can be selected at a time to visualize the data in a time series chart highlighting the erroneous data sections. This feature indicates the percentage of data deviation from the ideal conditions.
Conclusion
Baikal is a powerful data governance tool that helps organizations to improve the quality of data used for analytics and decision-making. Its advanced algorithms and automation capabilities allow for early detection of data-related issues, and its comprehensive view of data quality helps organizations to identify patterns and trends. With Baikal, organizations can increase efficiency and make better decisions, leading to improved performance and increased profitability.
About Author


