Imagine a tool that not only allows you to oversee your renewable assets but also provides a dynamic and visual perspective, transforming the way you make decisions. That is Prescinto’s game-changing Map View 2.0—a feature that not only simplifies but also revolutionizes renewable asset management. It offers a geospatial representation of your assets, making navigation, identification, and understanding of your assets easier than ever before.
With interactive mapping capabilities and a host of filtering options, Prescinto empowers you to take control of your assets and make informed decisions with unparalleled clarity. Prescinto’s Map View 2.0 allows you to swiftly identify all plants experiencing breakdown or partial breakdown statuses within just two clicks.
In this blog, we’ll delve into the heart of this transformative enhancement and explore how it’s set to redefine the future of renewable energy asset management for you.

Global Search and Filters: Find What You Seek, Instantly
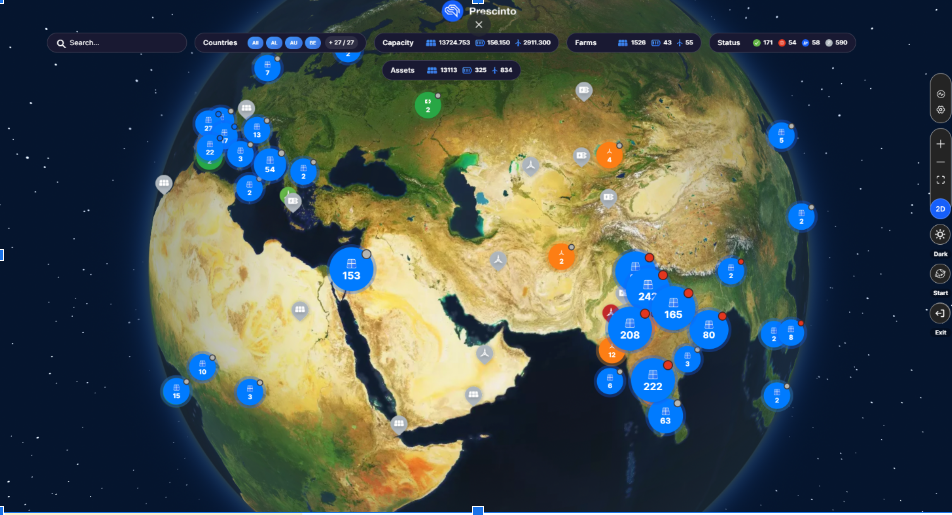
Prescinto’s Map View 2.0 comes equipped with a powerful Global Farm Search capability, designed to transform your asset management journey. It’s your shortcut to quickly pinpoint plants based on various criteria, ensuring you find exactly what you’re looking for. We’ve gone the extra mile by including four key filters:
- Country Filter: Narrow your search down to specific countries or regions, enabling you to focus on plants within your preferred geographic area.
- Capacity Filter: Tailor your search to match your asset’s capacity, whether you’re interested in high-capacity installations or smaller-scale plants.
- Farm Filter: Easily locate plants by their unique identifiers and filter them by the Wind, Solar, or Energy Storage domains, to streamline your view.
- Status Filter: Stay updated on your plants’ status. Quickly identify Running, Error, Idle, or Non-Communicating Farms, and gain real-time insights into their health.
With Prescinto’s Global Search and Filters, asset owners can swiftly access specific plants across countries for performance review or maintenance planning by using the Country Filter. Meanwhile, asset managers can efficiently manage varying-capacity solar farms by tailoring searches with the Capacity Filter. In addition, renewable energy asset operators can leverage this feature to monitor multiple wind farms’ statuses and schedule maintenance using the Status Filter, ensuring optimal performance.
Portfolio Summary: Your Asset Management Shortcut
The “Portfolio Summary” is your trusted companion in Map View, offering consolidated, essential information about your plants. It simplifies the monitoring and management of multiple plants in a clear and organized manner. Here’s what you can expect:
- Farm List in Ascending Order of Priority: Prioritized based on specific criteria like unavailable capacity and generation potential. High-priority items take the top spot for quick and effective attention.
- Unavailable Capacity: Understand the portion of a plant’s capacity that is not currently operational or available for use.
- Root Cause for Downtime: Get insights into the root causes of downtime, whether it’s equipment failures, maintenance issues, or communication failures.
- Typical Duration of Downtime: Discover the typical duration of downtime or lost communication for each plant.
This portfolio card streamlines your asset management by presenting the most critical information upfront, making it easy to assess which plants need attention and plan for optimal performance.

Farm Overview Card: Real-Time Insights
The Farm Overview Card offers a comprehensive snapshot of a specific plant’s performance in real-time:
- Farm Status: Gain a quick overview of the plant’s overall health, whether it’s Running, in Partial Breakdown, Full Breakdown, Idle, or Communication Failure.
- Live Metrics and Metadata: Understand the farm’s installed capacity and key live metrics based on the domain, allowing you to maximize your farm’s potential.
- Individual Asset Status Summary: Get an overview of the health and performance of assets within the farm, helping you identify issues that require attention.
- List of Devices in Error or Communication Failure: Troubleshoot and address problems promptly with this section, listing devices experiencing errors or communication failures.
- Live Chart of Critical Parameters: Monitor farm performance in real-time with a live chart displaying critical parameters essential for decision-making, particularly for wind and solar domains.
With this, asset owners can quickly assess the overall health of each plant, identifying issues like breakdowns or communication failures. Moreover, renewable energy asset managers can benefit from the Individual Asset Status Summary, which provides an overview of asset health and performance, aiding in issue prioritization and resource allocation. The Live Chart of Critical Parameters is critical for operators to monitor farm performance in real-time, making proactive decisions to ensure optimal operation.
Zoom to Farm (Wind): Dive into Wind Farm Management
With the Zoom to Farm feature, you can explore specific wind farms in greater detail. Examine each individual turbine within the farm and access real-time data on the status of each turbine, including whether it is Running, in Error, Service, Pause, or Offline. Live metrics related to turbine operations are also readily available, ensuring you have up-to-date information at your fingertips.
Tailor Your Map View Experience: Your Map, Your Way
We understand that asset managers have diverse needs, particularly those in Remote Operation Centers (ROCs). To provide the best possible Map View experience, we’ve introduced significant enhancements:
- Satellite and Street Views: In Prescinto’s Map View 2.0, you have the flexibility to choose between two distinct map layers. With Satellite View, you can delve into the world with high-resolution satellite imagery, ideal for in-depth exploration and analysis. Alternatively, if you prefer a more traditional perspective, Street View allows you to navigate using recognizable streets and road maps, complete with labels and points of interest. Moreover, with unique custom skins, you get to personalize your Map View, ensuring it matches your individual preferences seamlessly.
- Dark and Light View Modes: Choose between Dark and Light View Modes to match your preferences. The “Dark Mode” offers a darker background with lighter text and elements, while the “Light Mode” provides a more traditional, brighter background with darker text. Additionally, the “Auto” option automatically switches to dark mode after a predefined time to reduce eye strain during nighttime or low-light conditions, ensuring your comfort.
- Globe (3D) and 2D Views: Dive into the world of asset performance management with the flexibility of 3D and 2D viewing modes. 3D view allows you to rotate, zoom in, and zoom out to explore the Earth from various angles. Both 3D and 2D views support clustering your plants, making it easier to manage large portfolios. Whether you crave in-depth analysis or practical asset management, Prescinto’s Map View 2.0 offers a tailored experience.
Bottomline
For clean energy asset owners, managers, and operators, the question is simple: Will you embrace the future of renewable asset management, or will you settle for the status quo? Prescinto’s Map View is your opportunity to revolutionize your approach and elevate your portfolio management to new heights.
So, what are you waiting for? Unleash the full potential of your renewable assets with Prescinto’s Map View 2.0— your gateway to precision, efficiency, and unparalleled success. It’s time to make every decision count, and it starts here.