Traditional methods of analyzing plant performance may not be sufficient to detect advanced problems, leading to financial losses due to decreased productivity. This underscores the need for advanced tools to effectively detect and diagnose underperformance issues in solar power plants.
What is Tahoe?
Tahoe is an AI-based data analytics tool developed by Prescinto, a leading clean energy SaaS Asset Performance Management (APM) solution provider. It is specifically designed to help solar power plants identify the underperformance caused by various systemic issues such as soiling, clipping, curtailment, and other losses. Tahoe provides real-time and actionable insights directly from the platform to the plant owner, without requiring them to do any manual data crunching.
How does Tahoe work?
Tahoe uses a combination of machine learning algorithms, pattern recognition techniques, and regression analysis to classify the losses into 12 loss buckets. This classification is done by creating a correlation between different plant parameters.
The classification helps plant owners to prioritize the remedial actions and make informed decisions.
Tahoe uses a patent-pending machine learning algorithm to accurately quantify losses in a solar power plant. The algorithm creates a digital twin of each inverter, which closely mimics the performance of the physical inverters at the site. This digital replication allows Tahoe to detect even small variations in the generation pattern, as little as 1-2%, and quickly identify underperforming assets. The algorithm’s ability to create digital twins of the inverters and analyze them in real-time allows plant operators to quickly identify and address issues, improving the overall performance of the plant
Tahoe uses advanced algorithms to filter out bad data and ensure only high-quality data is analyzed. Two levels of data quality checks are implemented to ensure accuracy:
- Rule-based: Data is filtered using 9 pre-determined rules to ensure only the best quality data is used
- Regression-based ML algorithm: Removes unobvious or unusual data from the analysis, improving the accuracy and reliability of the results.
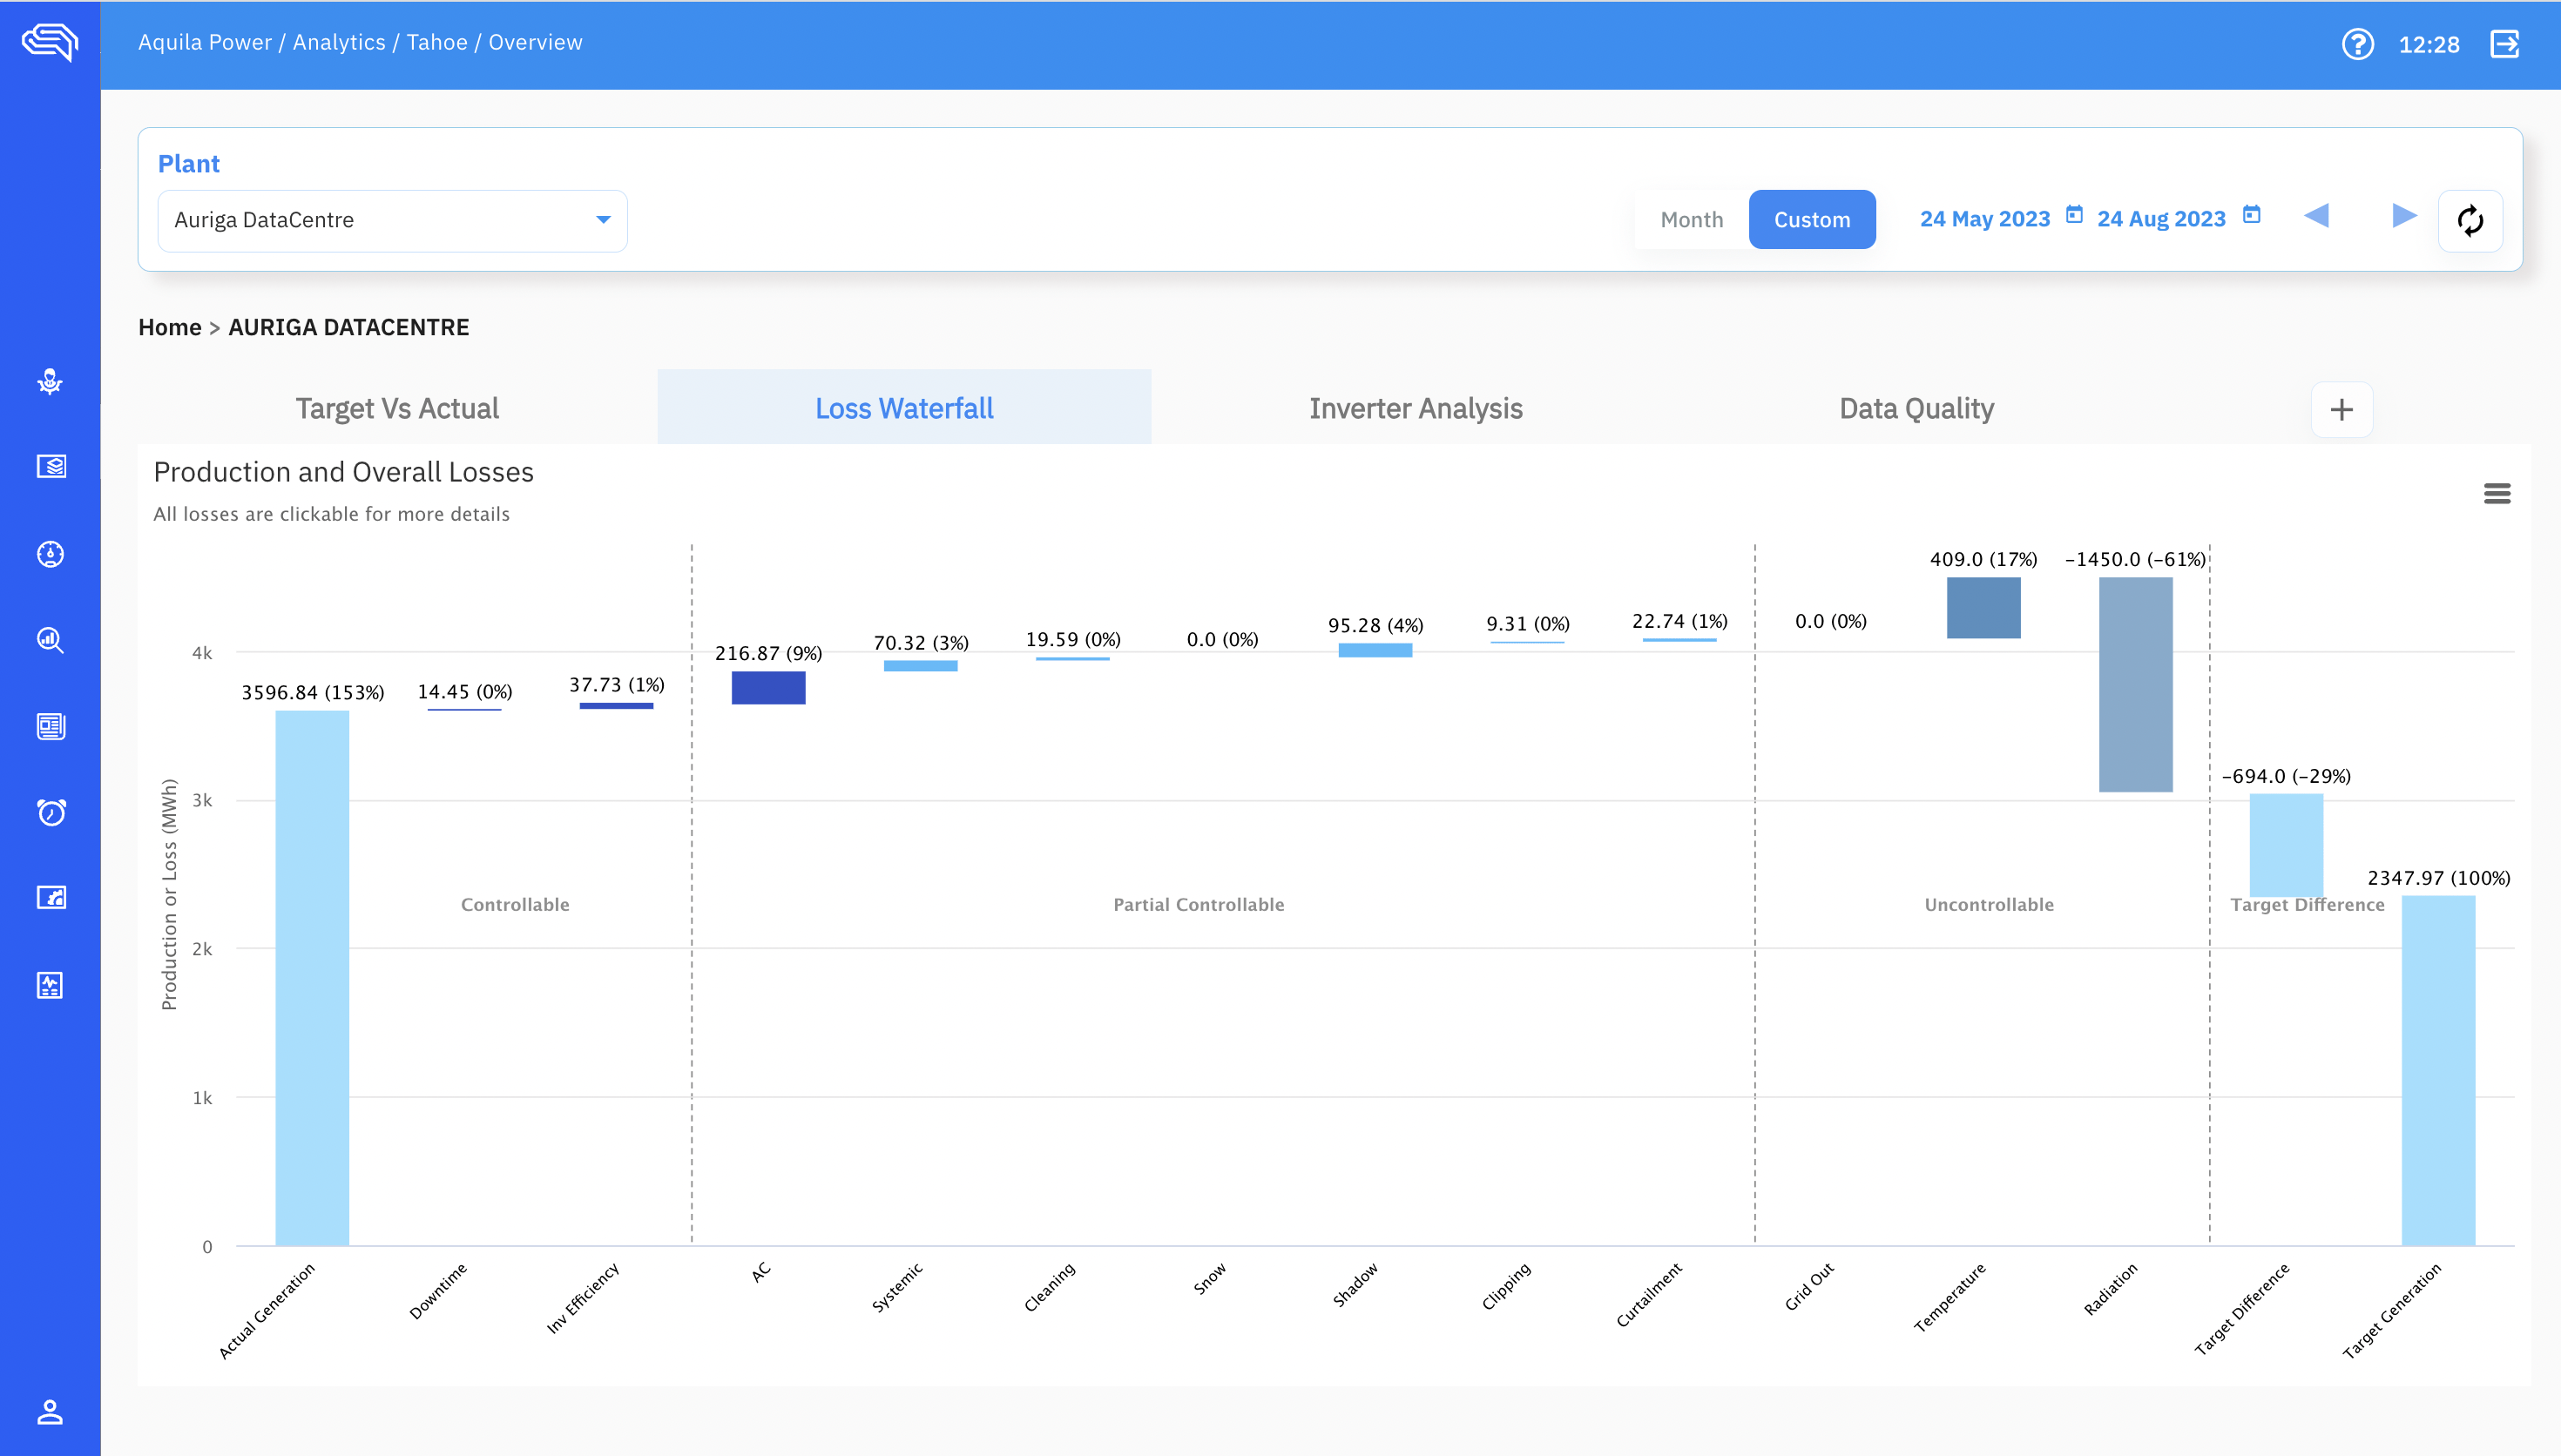
Once the bad data is filtered out, the remaining data is used for Tahoe analytics. The data is then categorized into the following specific loss buckets for further analysis and decision-making.
Controllable Loss
Controllable losses refer to types of losses that can be controlled and possibly eliminated through specific actions. Among the most common controllable losses that occur at the inverter level include
- Downtime Loss: Energy lost due to unexpected outages or downtime of any component in a solar plant, even when there is sufficient irradiance.
- Inverter Efficiency: The efficiency of an inverter, usually between 96% and 98%, can vary depending on the input energy (DC) and output energy (AC) and could be less than usual depending on the DC power and voltage.
Inverter-wise losses. Determine Controllable Losses Easily
Partially Controllable Loss
There are certain losses that you can control to a certain extent but cannot be eliminated completely. These losses often depend on various factors and may occur either at the inverter level or plant level. The following are the critical loss buckets in partially controllable losses:
- AC Loss: energy lost during AC transmission and in the transformer.
- Systemic Loss: losses that occur between solar modules and inverter DC output due to equipment degradation and breakdowns, inverter derating, DC array downtimes, module hotspots, and module damages.
- Cleaning Loss: loss due to poor panel cleaning or fewer cleaning cycles resulting from dust, dirt, and bird droppings on glass surfaces.
- Snow Loss: loss due to snowfall preventing sunlight from reaching solar panels.
- Shadow Loss: loss due to shadows from nearby trees, antennae, poles, other panels, and landscape affecting the amount of irradiation a panel receives.
- Clipping Loss: energy wasted in a solar PV system due to the inverter reducing its output to meet its maximum power rating.
- Curtailment Loss: loss due to deliberate reduction in the output below capacity to balance energy supply and demand or due to transmission restrictions in grid-connected power plants.
Uncontrollable Loss
Uncontrollable losses are those that cannot be controlled or eliminated as they are caused by external or natural factors. These types of losses typically occur at the plant level and often involve the following:
- Grid outages: Losses caused by the grid being unavailable even when sunlight is available.
- Temperature Loss: The decrease in output from solar panels due to high temperatures.
- Radiation Loss: Losses caused by insufficient sunlight, which is unpredictable and can reduce power generation.
Benefits of Tahoe
The benefits of using Tahoe are numerous for solar plant owners to operators. The ultimate goal of using Tahoe is to quantify the losses into various buckets, enabling data-backed decision-making. Among the many benefits that Tahoe provides, the following are the ones that most customers find to be the most beneficial:
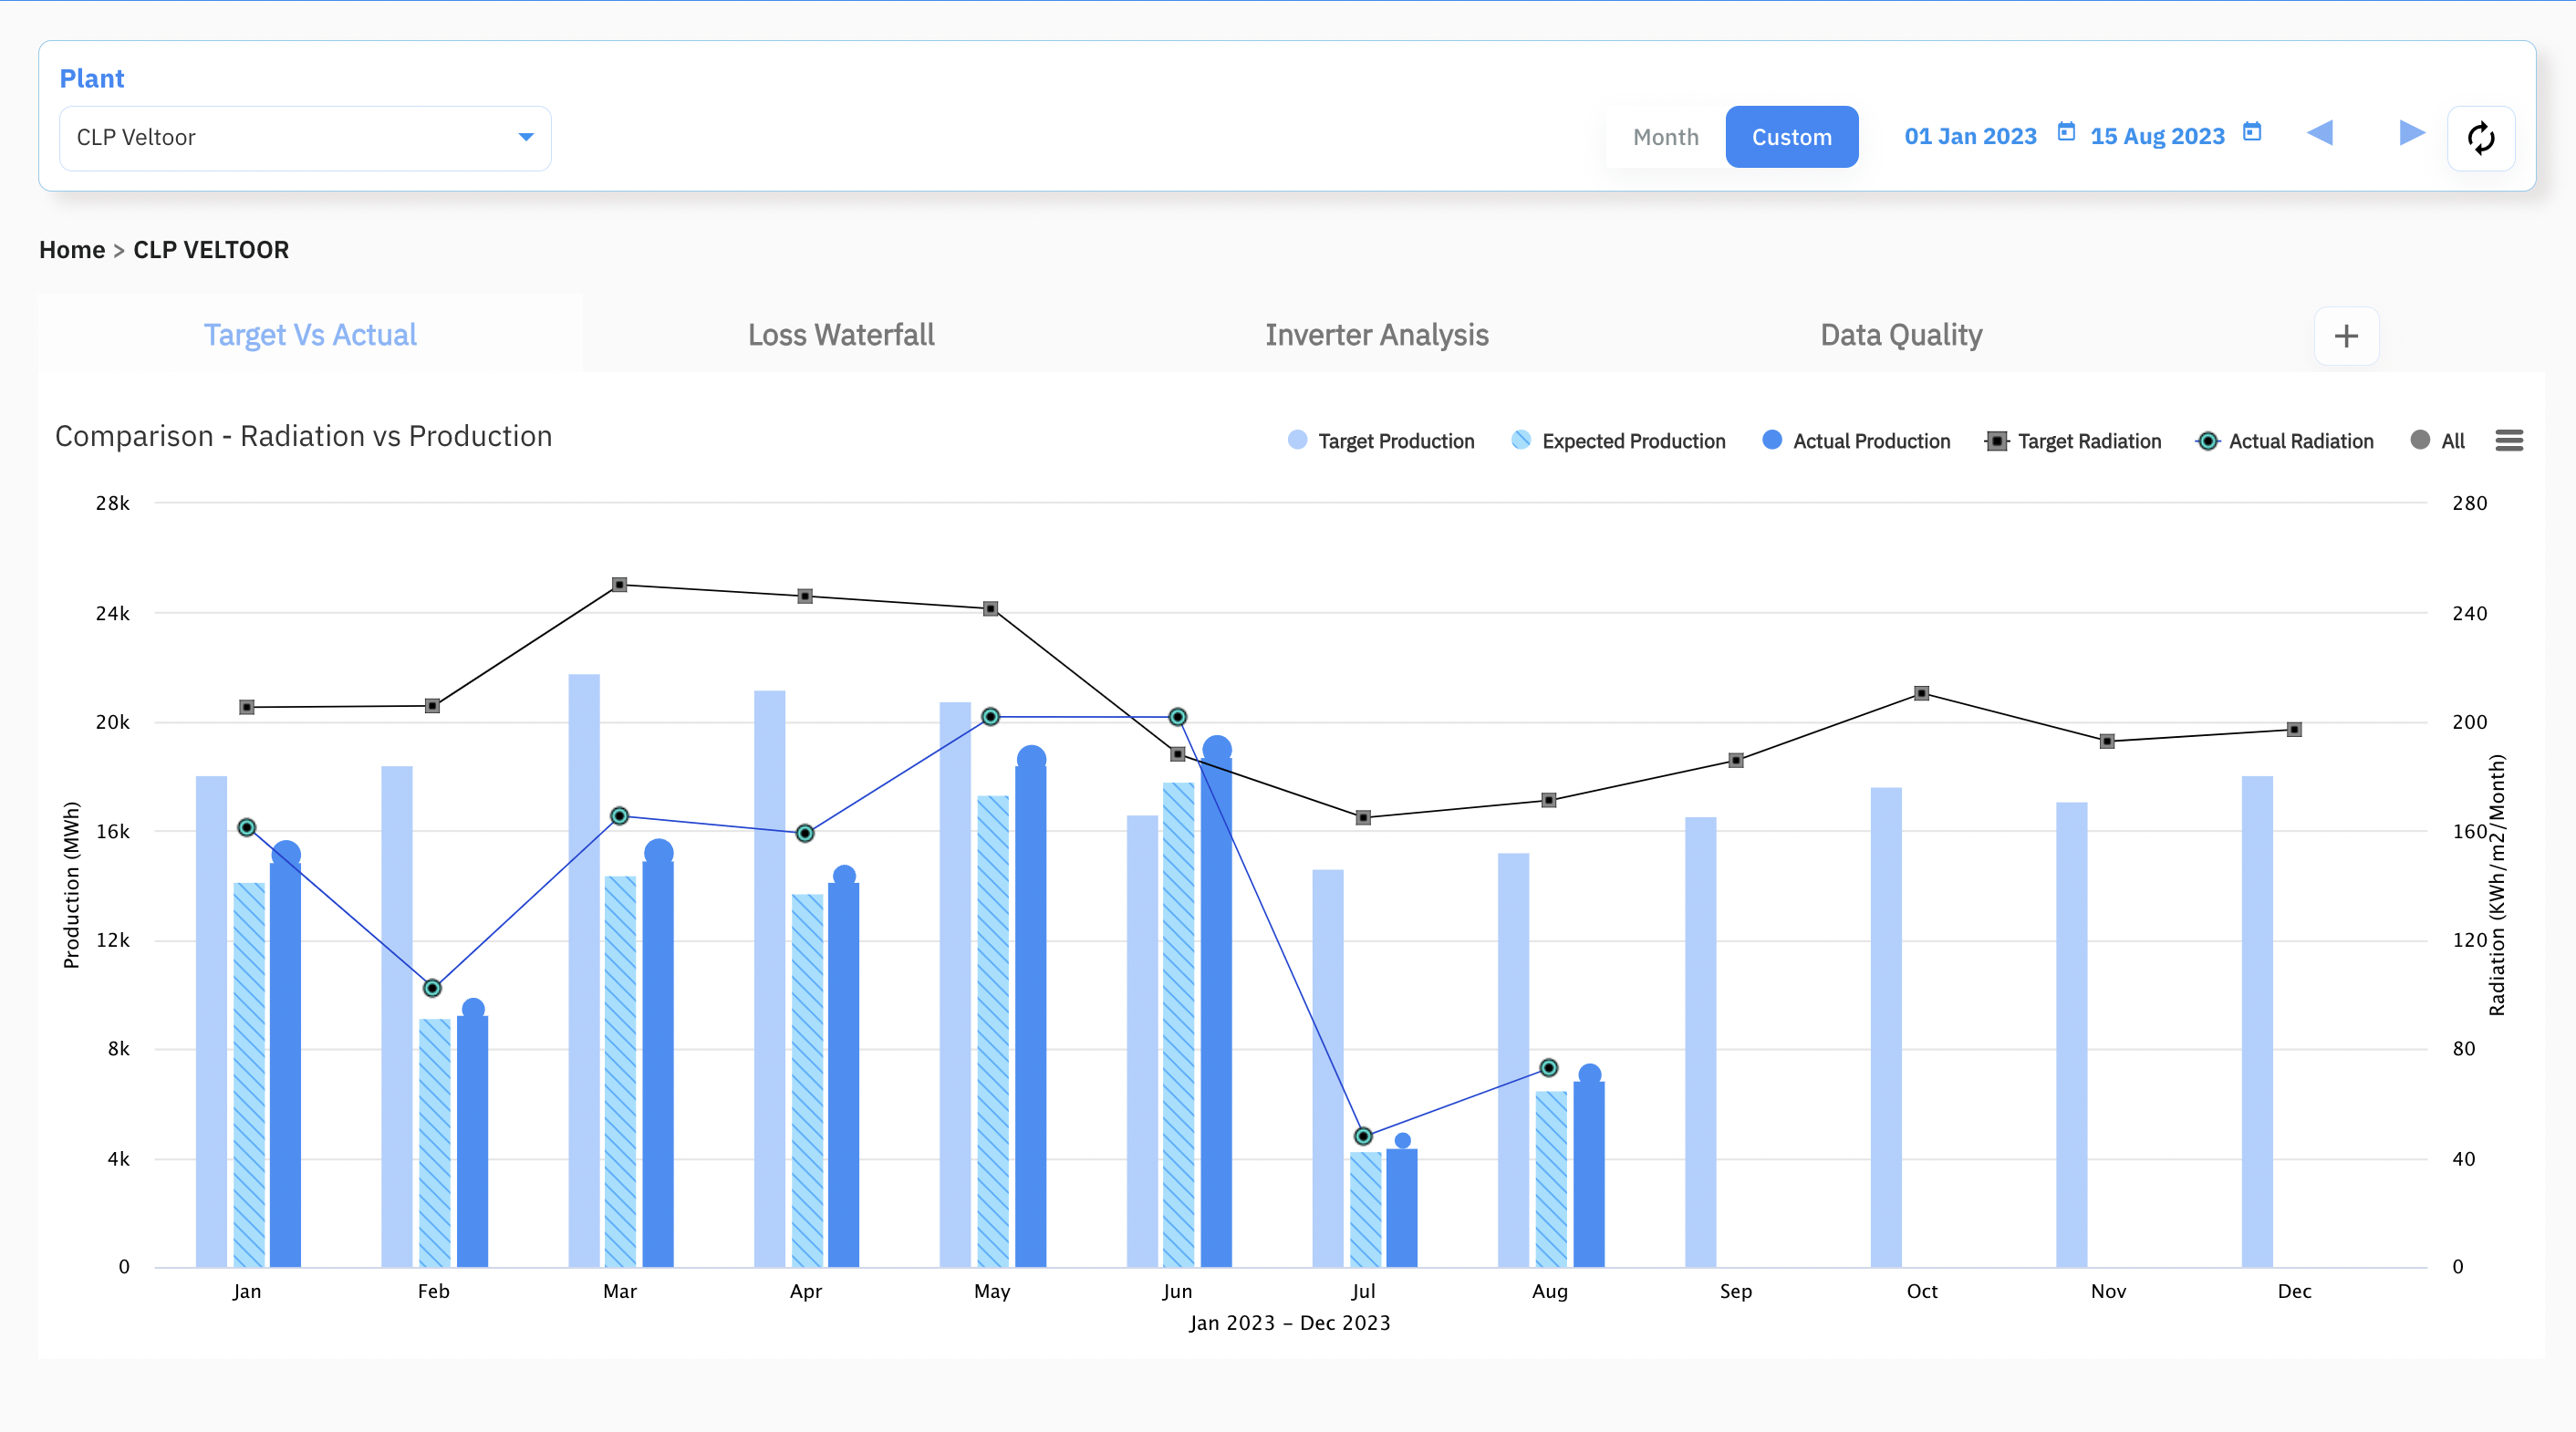
Real-time insights
Tahoe offers real-time insights to the plant owner, enabling them to detect losses in a timely manner and take prompt actions.
Analyse Cleaning Efficacy
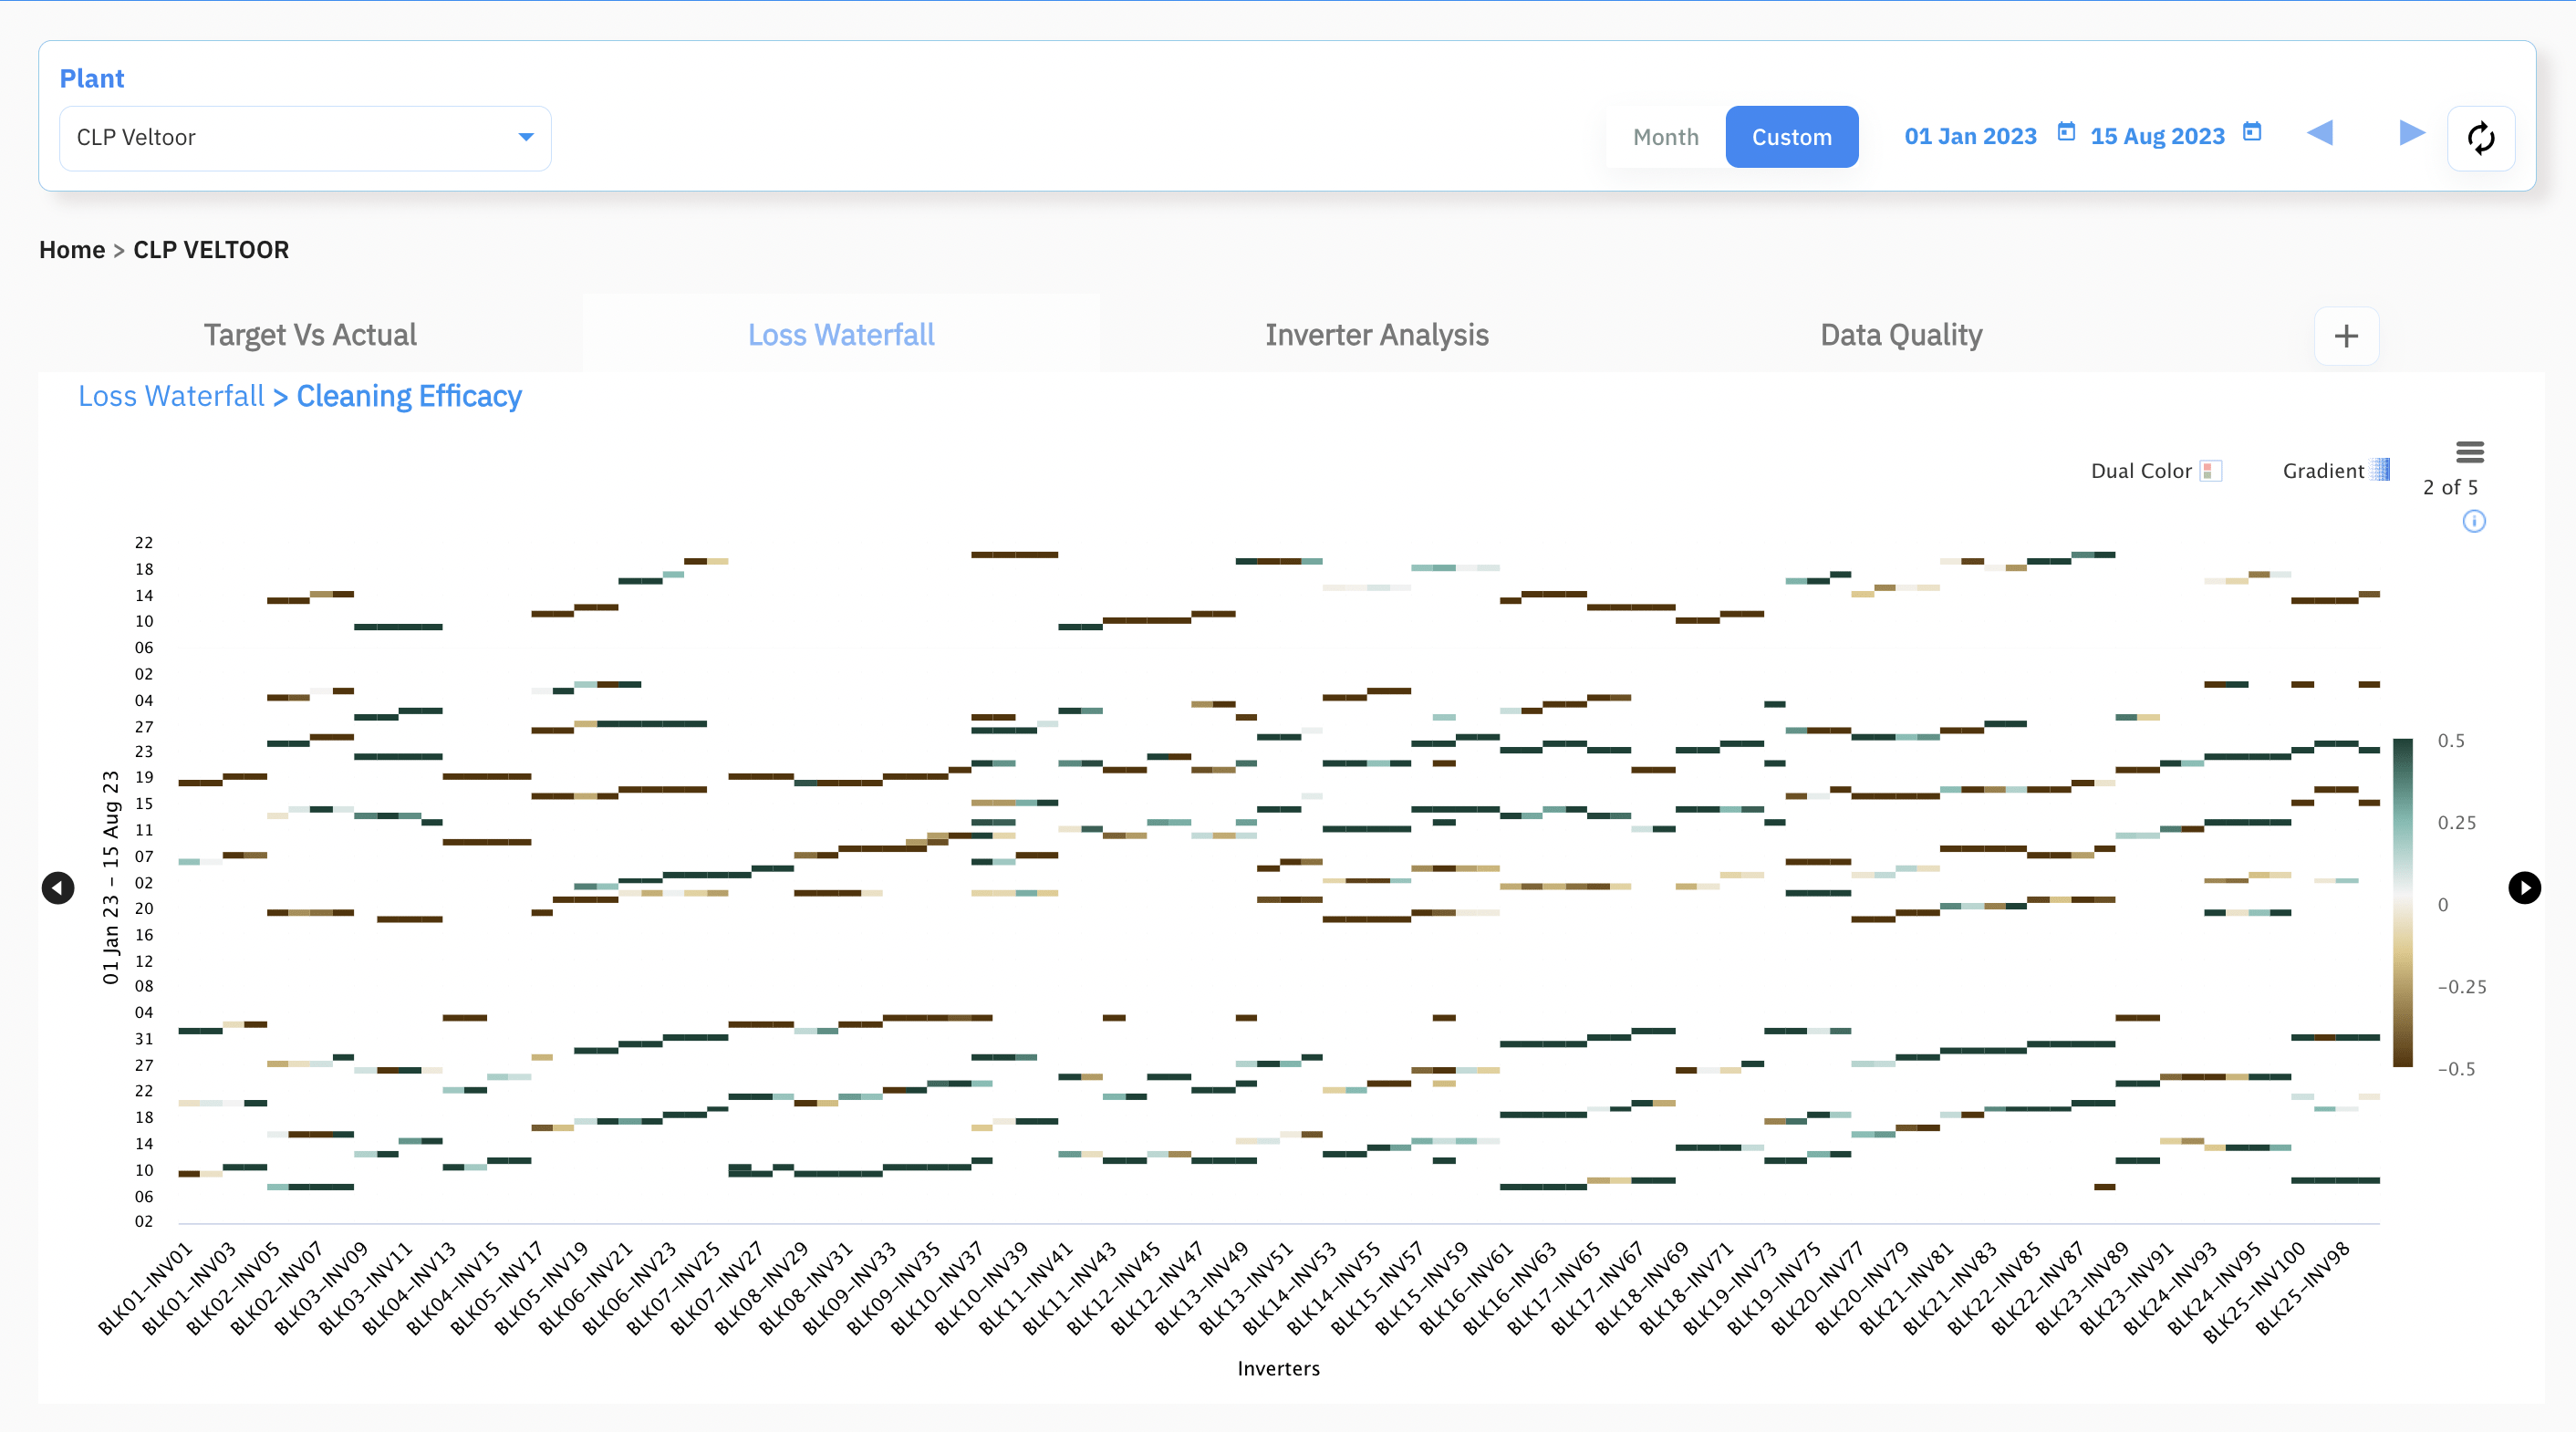
The aim of Module cleaning is to reduce Cleaning Loss. Tahoe helps quantify the reduction in cleaning loss and determine the effectiveness of cleaning efforts, allowing for more informed decisions on when and where to schedule future cleaning for specific inverters.
Accurate loss classification
Tahoe precisely classifies the losses into 12 different categories, allowing plant owners to prioritize remedial actions and make informed decisions.
Efficient data analysis
Tahoe automates the data analysis process, increasing efficiency and saving plant owners the time and resources that would have been spent on manual data analysis.
Determine Rainfall Efficacy
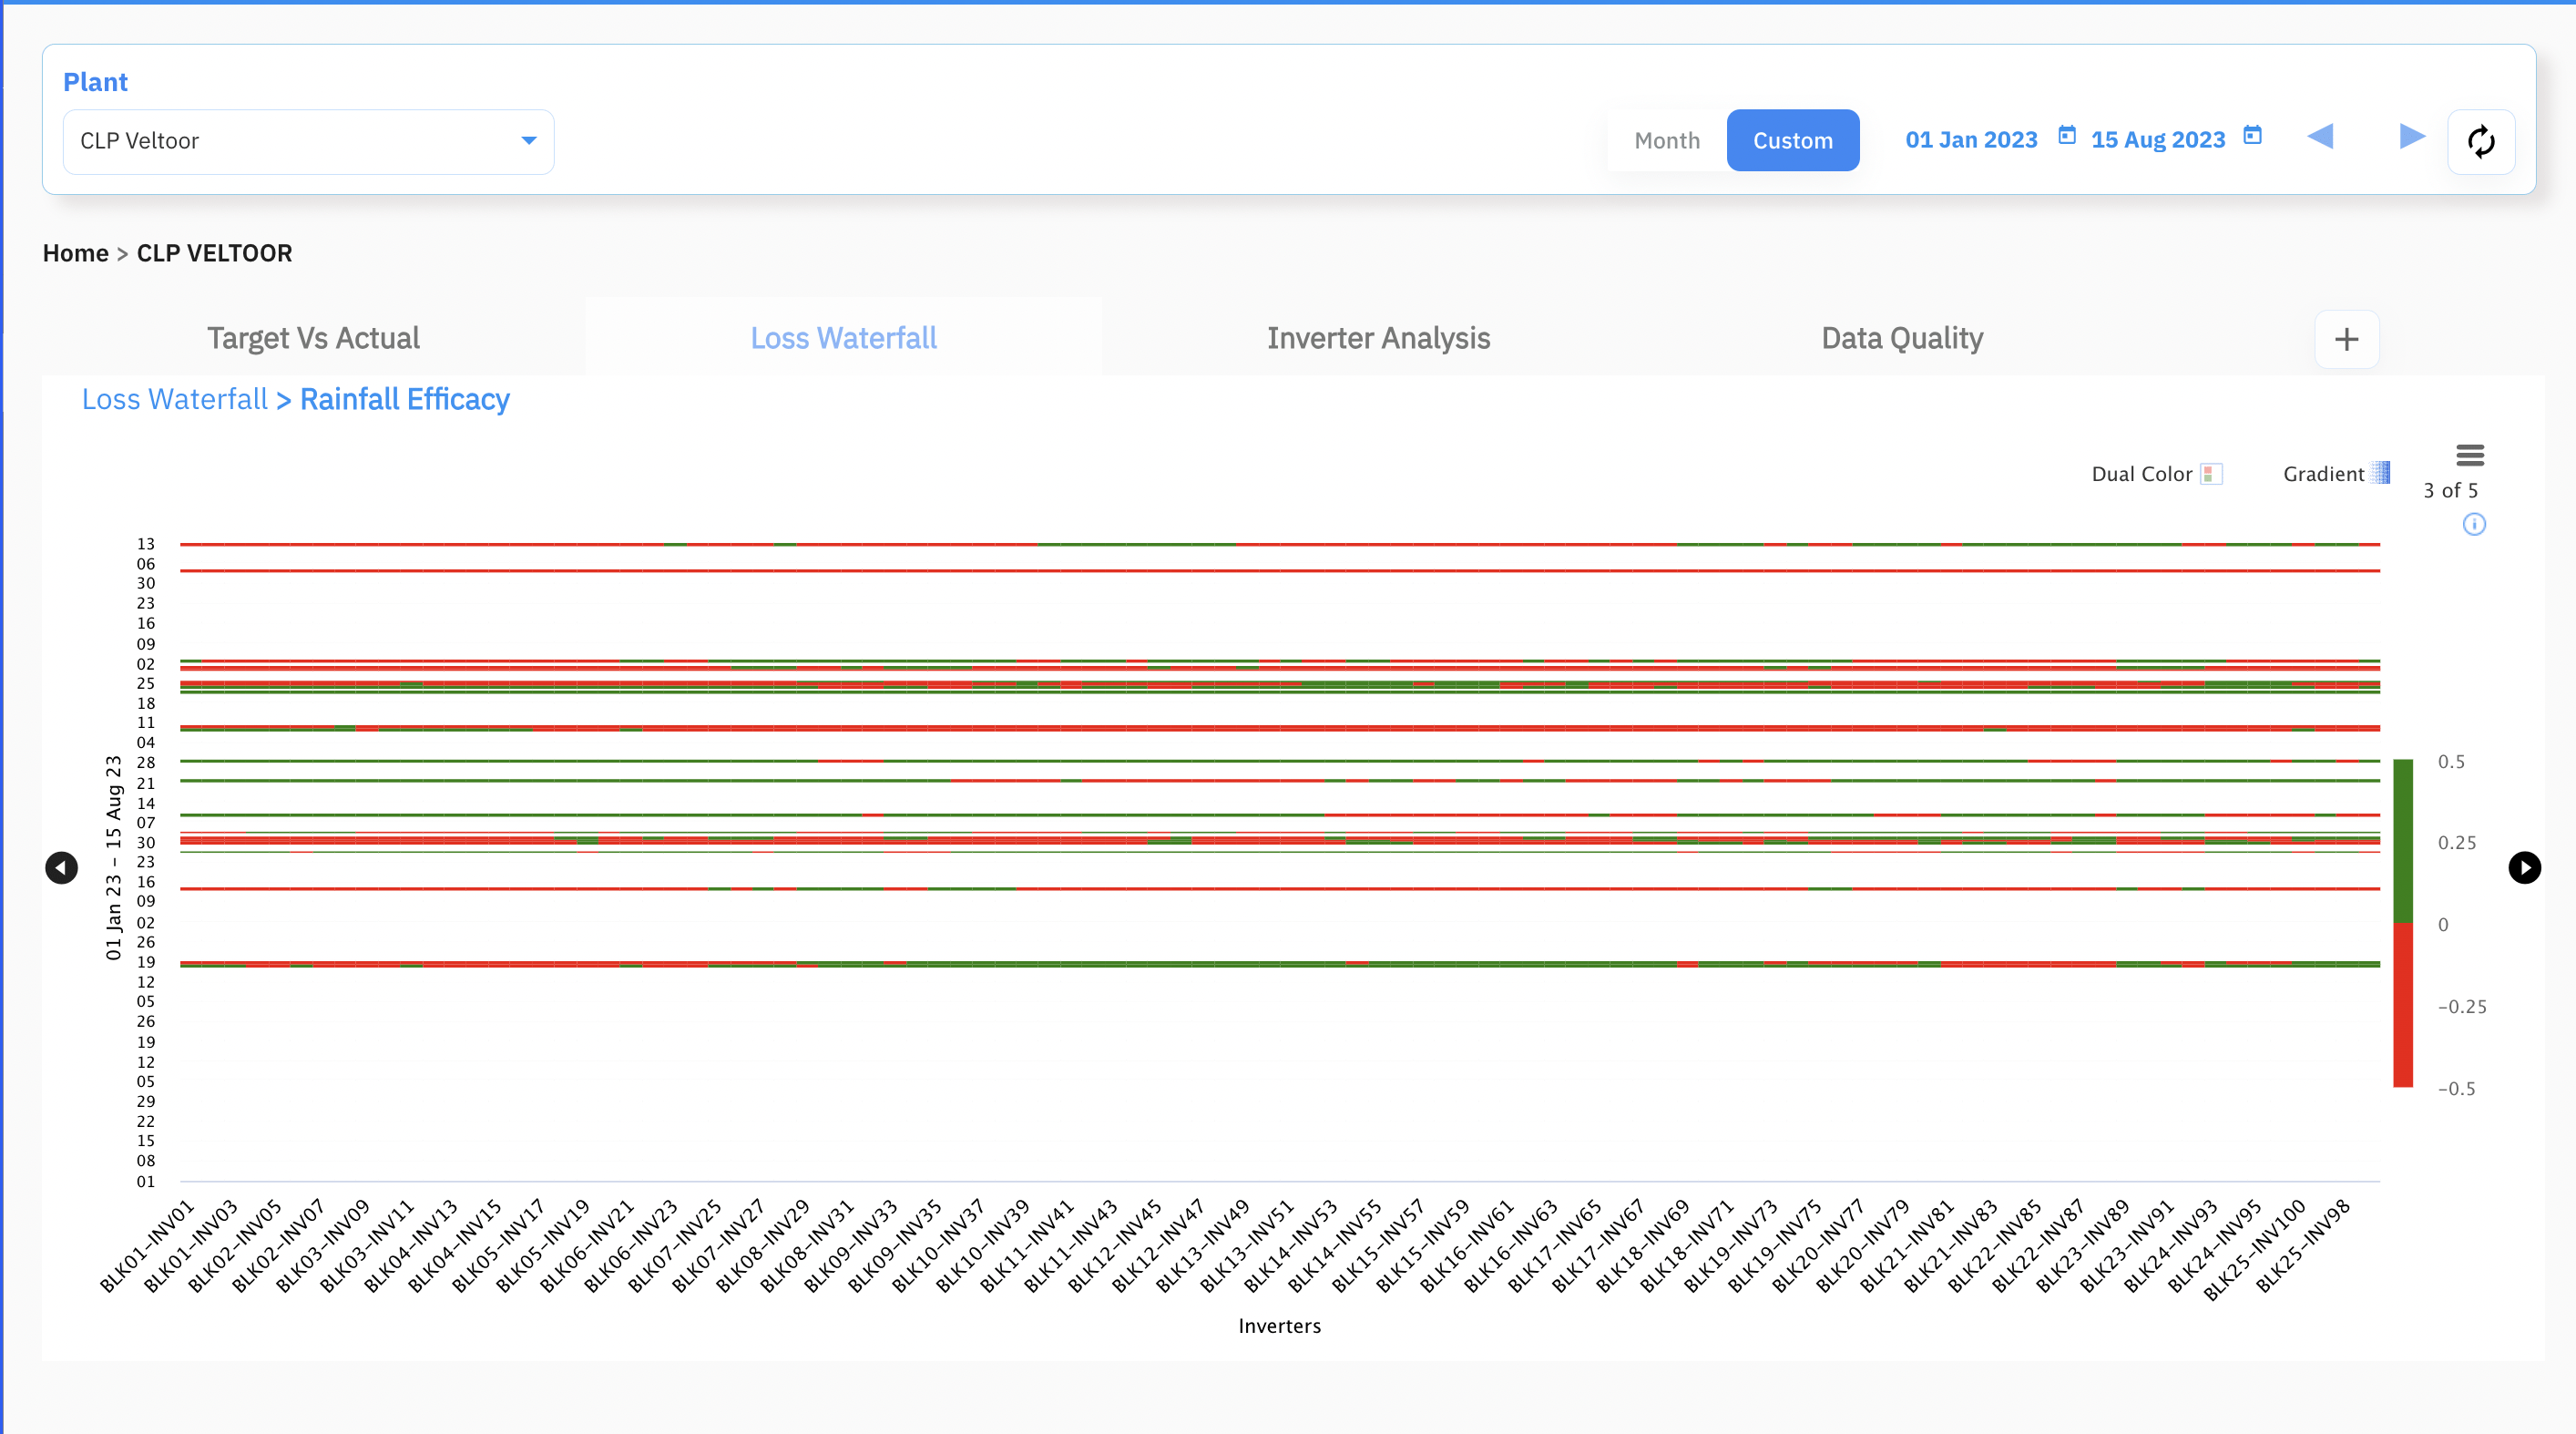
“All Rains are not good” Rainfall Efficacy feature of Tahoe helps to determine whether cleaning should be delayed or done immediately based on the amount of rainfall and level of dust accumulation. It also identifies which inverters require more attention for cleaning.
Conclusion
Tahoe is a powerful tool for optimizing the performance of a solar power plant. It provides real-time insights, accurate loss classification, and automation of data analysis, saving time and resources for the plant owners. By identifying and classifying the losses into various buckets, plant owners can prioritize their remedial actions and make informed decisions. This leads to improved performance and increased generation of the plant.
With Tahoe, the plant owners and operators can have the confidence that they are maximizing their plant’s performance and ROI.