Maximizing generation is no trivial task, for asset managers of renewable assets. As an O&M service provider or solar plant owner/manager, it is critical to understand the performance and health of your solar module. Identifying non-performing, damaged, and degraded solar panels is a challenging task sheerly due to the expanse of the solar assets.
According to IEA, 2022 was solar power’s year. Solar was popular among investors as it showed a huge increase in absolute growth in the renewable field. As a result, it was able to bag 45% of total global electricity generation investment within the same year. With more solar panels and with more investments the need for checking the health of solar panels is even more than before. By measuring the current and voltage of your modules and the balance of systems (BOS), you can create a picture of your asset’s true capacity and expected output. IV curve testing is a common method to test the generation capabilities of Solar panels. However, different organizations follow different methods to identify the suspected non-performing strings to conduct this field testing.
Prescinto’s string analytics, an AI-driven analytics module to identify the underperforming string. Moreover, diagnosing the possible reasons for the non-performance. This helps asset managers to zero on the small set of strings to focus on for improvement. Hence, it improves the asset management effectiveness almost 15 times.

What is IV Curve?
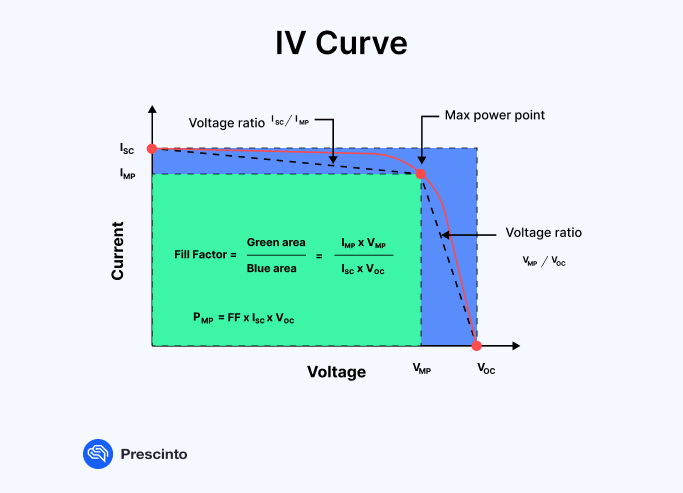
The current-voltage (IV) curve of a solar cell, module, or string shows the relationship between the current (I) and voltage (V) that it produces under constant illumination conditions. A specialized equipment called an IV curve tester generates the curve. To ensure accurate results, the test is done when irradiance is more than 600W/m2.
Measured at time intervals over the lifetime of a solar panel, IV curves track changes in performance. It is not uncommon to test the cells under various controlled lighting and temperature conditions in labs. This is specifically done to fully characterize the device. The detailed voltage-current data generated provides deep insights into the operational behavior of the photovoltaic device.
Key Parameters of IV Curve Testing
- Open-Circuit Voltage (Voc): The open-circuit voltage is the maximum voltage available from a solar cell or module. It occurs under illuminated conditions when the terminals are not in connection (open circuit) and no current is flowing.
- Short-Circuit Current (Isc): The short-circuit current is the maximum current that can be drawn from the solar cell or module. It occurs when the terminals are shorted together (zero resistance) and the voltage across the device is zero.
- Maximum Power Point (MPP): The maximum power point on the IV curve where the product of current (Impp) and voltage (Vmpp) reach their maximum. This results in peak power output (Pmax). Modules which operate at this point to extract the most power.
- Maximum Power (Pmax): The maximum power output available from the solar module under the illumination conditions. It occurs at the IV curve’s maximum power point and is calculated by multiplying Impp and Vmpp.
- Fill Factor: The fill factor is the ratio of the actual maximum power delivered to the theoretical power if both voltage and current were at their maximum values (FF = Pmax / (Voc x Isc)). It quantifies resistive losses. Higher fill factors, typically 0.7-0.8 for silicon cells, correspond to higher efficiencies.
Solar Cell IV Curve Testing
The solar panels or strings that are tested are directly connected to the IV curve tester through the terminals. With the help of the electrical loads they contain, the voltage across the panel or string may be methodically changed from short circuit to open circuit values. The IV tester accurately measures the associated current at each voltage point.
Stepping through many voltage points within the IV range and measuring the corresponding current, the tester plots the whole IV curve for the panel or string. The form of the curve is solely dependent on the physical components and composition of the solar cell or module. This is because lighting is at a consistent level through the use of calibrated solar simulators or real sunlight. Mounted next to the test module are the reference cells. They account for any variations in irradiance during the measurement.
According to this MDPI paper on solar PV degradation, solar modules start deteriorating at a rate of around 0.7% per year; however, this could change depending on the manufacturer’s requirements. Finding and measuring the rate of deterioration throughout the solar panel’s operational lifetime is the main goal of IV curve testing.
Key performance metrics such as Isc, Voc, Pmax, and fill factor may be closely monitored by taking frequent measurements of the IV curve features under reliable testing settings. To align solar cells and modules for panel building and system installation, testing enables sorting and binning of those cells and modules, depending on output characteristics. A degradation rate rise that exceeds justified levels is a precursor to underperformance problems.
IV curve analysis allows for the identification of specific degradation mechanisms and defects that are causing accelerated aging. Physical factors like micro-cracks, moisture ingress, potential induced degradation (PID), soiling losses, and other module failures influence the shape of the IV curve. Distinct curve “signatures” reveal the root causes for targeted correction.
Benefits of IV Curve Testing
The curves made through IV testing serve as a unique blueprint for the output capabilities and overall health of the system. Therefore, it can avoid energy losses and maximize solar investment returns. Regular IV testing gives asset owners and operators the ability to track an installation’s performance over time. These are the benefits-
- Early detection of issues on the panel.
- Troubleshooting and diagnostics of solar installations.
How Does Prescinto’s String Analysis Work?
Prescinto brings cutting-edge string analytics. String analytics builds on top of Tahoe, Prescinto’s AI-powered loss bucket analytics.
String analytics leverages IV curve measurements to optimize performance and reliability. By connecting IV curve tracers to solar strings, asset managers can evaluate the combined current-voltage relationship of all modules in series. As IV Curve testing is a costly service, solar plants undergo this testing on a random sampling basis with 10 to 20 strings under consideration. While IV Curve Testing tries to find the percentage drop in performance based on the specification sheet capacity and actual fill factor, Prescinto’s string analysis gives you the ranking. With Prescinto, asset managers can make data-driven decisions to test low-performing strings, optimizing operational expenditure.
Spreading across acres, approximately 30% of solar asset data is inconsistent and of poor quality. Prescinto addresses this challenge using machine learning algorithms to remove the bad data points to avoid bad results. The ranking of the remaining strings is based on the peak-specific current. Thus, the ranking of strings is based on electrical tags. Prescinto also correlates the results with thermographic analysis.
Prescinto’s detailed analytics identify underperforming strings and the weakest modules limiting output. Likewise, ensuring optimal binning of matched panels in each string to minimize mismatch losses. Precise IV models enable accurate prediction of real-world production levels and pinpoint energy loss mechanisms. Prescinto’s string analysis benchmarks string IV parameters over time to detect early signs of degradation. This allows asset owners to proactively maintain their solar plants before losses occur.
Conclusion
Analyzing IV curves has become a vital maintenance tool as PV systems expand internationally. They enable asset owners, managers, and operators to leverage data-driven performance optimization and risk mitigation tactics. As a result, aid them to maximize the return on their solar investments.
Solar PV systems guarantee to generate the anticipated returns on investment by implementing strong IV curve analytics, whether in production or over a multi-decade period of operation. These testing procedures will be crucial for the sustained expansion of solar power generation due to their capacity to identify anomalies and issues at the component level.